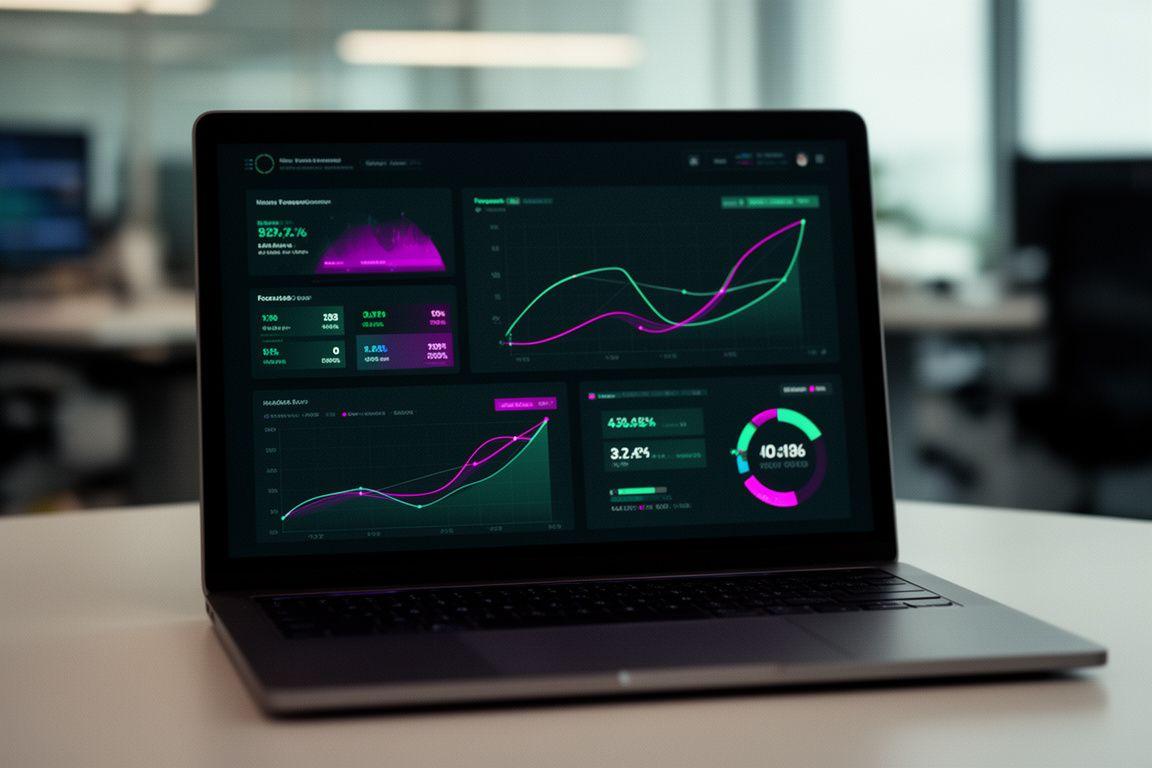
Sharper KPI focus
Which metrics actually move revenue, margin, and service quality? We map the answer first, then build the interface around it.
Trusted delivery
From data audit to user training, we keep the rollout calm, structured, and easy for teams to adopt.
Why Businesses Choose SageSight AI
If your reporting feels slow, fragmented, or too manual, why keep patching it together? We build dashboards that give leadership a faster route to action.
Custom AI Dashboards Built Around Your KPIs
We don't force your business into a template. Instead, we design around the questions your board, managers, and analysts keep asking every week.
Built to reflect sales, operations, finance, and service metrics in one place.
Designed for clarity, so leaders can ask better questions in fewer meetings.
Flexible enough to evolve as your priorities shift across the year.
Outcome-led design
What does success look like for your team? Faster reporting, cleaner forecasting, and fewer blind spots are usually the first wins we chase.
Predictive Analytics
Forecast demand, cashflow, and risk with AI layers that surface what's next, not just what happened.
Real-Time Visualisation
Keep your team aligned with live charts and clean views that make messy datasets easy to read.
Connected Systems
Bring together spreadsheets, CRMs, finance tools, and operational data without creating another reporting headache.
Stakeholder Friendly
Executives need the headline, analysts need the detail, and everyone else needs the story to make sense fast.
From Raw Data to Real Insight
The route is simple, but it has to be disciplined. Why rush the build when the best dashboards come from a clear understanding of systems, users, and decisions?
1. Discovery & data audit
We review your current reports, data sources, and bottlenecks. Where are teams losing time? Which metrics can’t be trusted yet? The audit answers that before any design work starts.
2. KPI mapping & dashboard design
We structure the interface around decision paths, not noise. That means leaders get clean summaries while analysts can still drill into the detail they need.
3. AI model integration
Predictive scoring, anomaly detection, and trend forecasting are layered in where they’ll make a measurable difference. No gimmicks. Just useful signals.
4. Deployment, training & optimisation
We launch, guide your users, and keep refining the setup as adoption grows. That’s how the dashboard stays useful long after the first release.
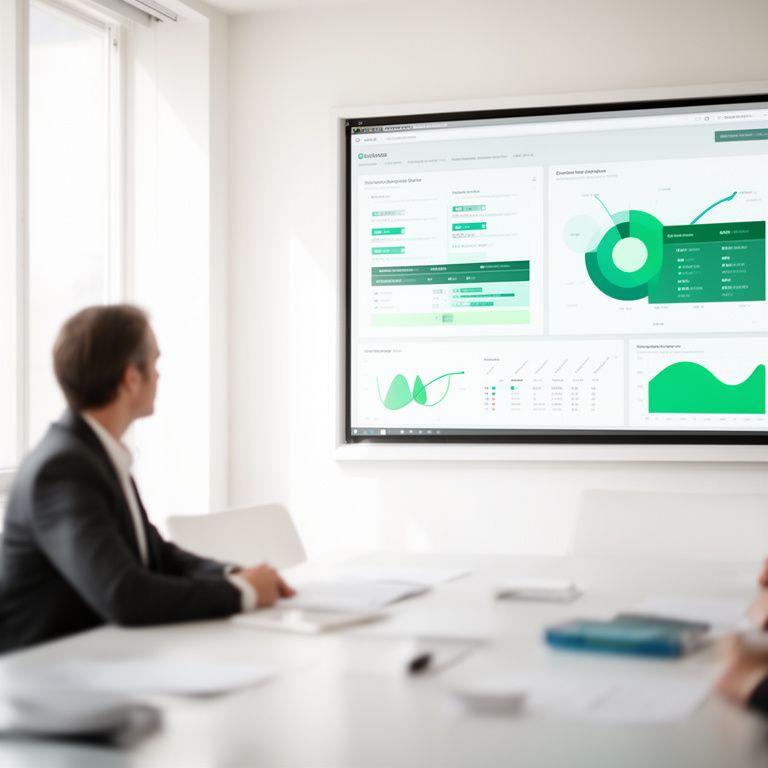
Built for adoption
A good dashboard isn't just accurate. It has to be easy to trust, quick to learn, and simple enough that busy people keep using it every day.
What Our Clients Say
They wanted faster reporting. They wanted clearer forecasting. They wanted less spreadsheet chaos too. Sound familiar?
SageSight AI gave our operations team a dashboard that cut weekly reporting from hours to minutes. Our directors finally had one source of truth, and the conversations changed immediately.

Why did we choose SageSight AI? Because they translated messy data into forecasting we can actually use. The model now flags pressure points earlier, so we’re making steadier decisions and wasting less time arguing over numbers.

The rollout felt orderly from day one. SageSight AI listened, challenged our assumptions, and delivered a dashboard that our regional managers still use every morning without prompting.